Working with Analytics and Detection Engineering in Incident Response with ELK
Introduction
According to the SANS Incident Response process, phase 2 – identification, and phase 3 – containment, are essential to reduce the impact of a cyberattack, as shown in the following diagram:
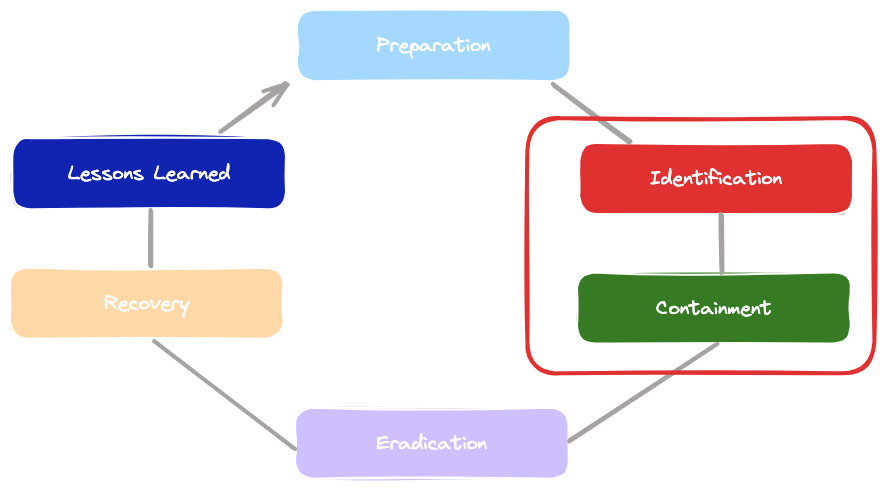
Incident response sometimes starts with the escalation of an alert or a user reporting the disruption of a service or the discovery of a data leak. Once a case has been created (with TheHive tool for example) regarding an incident, the next step is to follow the playbooks associated with the incident.
The more information you have about the incident, the better you can understand the nature of the attack, especially if you use frameworks such as MITRE ATT&CK and you have reliable threat intelligence sources of information.
However, at this point, you just have information about the incident’s symptoms, but not necessarily the root of the problem, which means that you may not know about the attack vector or the scope of the compromise.
Essentially, you can’t move efficiently to the containment phase if you don’t have enough information and context about the attack.
Between the detection phase and the containment phase, you need to be proactive, assertive, and efficient. Remember that sometimes, the attackers are on your network and every move can accelerate the attacker’s actions if they discover that you are trying to catch them.
There are six steps that you can follow to dimension the level of compromise, look for malicious indicators, and use this information to limit the damage of the attack. These steps are shown in the following diagram:
Step 1: Evaluate the nature of the incident: To evaluate the nature of the attack, you need to analyze all the information that’s available about the incident up to that point. By doing so, you can identify some tactics, techniques, and procedures (TTPs) that are used by the attackers.
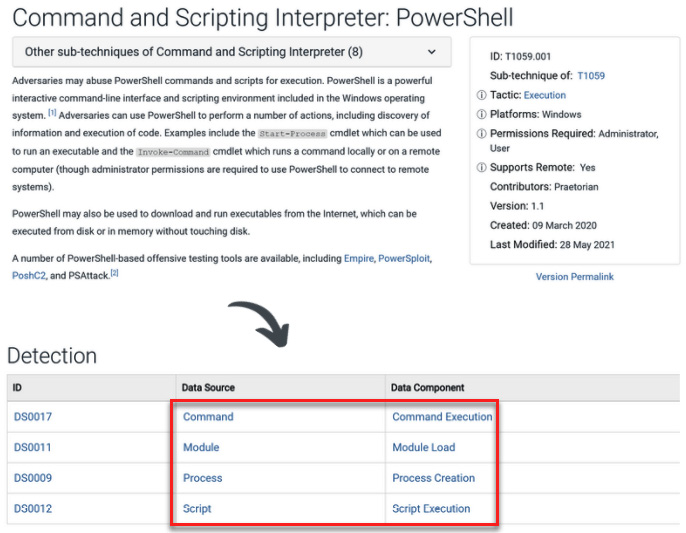
Step 2: Identify potential sources of information: Once you understand the nature of the attack, you will need additional information to find malicious indicators of the attack, so it is very important to identify other potential
sourcesthat you can get this information from, such as logs from the systems, network traffic, and more. MITRE ATT&CK is a good resource for identifying data sources where you can find malicious indicators – you just need to look for thedata componentsthat contain valuable information for a particular technique/sub-technique in the detection section, as shown in the following screenshot:
- Step 3: Generate analytics: When you identify the potential sources of information, you can model the way that you can detect malicious behaviors from these sources. This activity is known as detection engineering.
- Step 4: Create detection rules: An efficient way to detect malicious behaviors, especially at a large scale, is by creating rules or regular expressions based on your previous analytics. For example, you can create
Yara, Sigma, or Zeek/Suricatarules.
There are other projects that you should explore to create and use data analytics and develop detection engineering, such as Threat Hunter Playbook and Security-Datasets.
- Step 5: Identify IoCs and IoAs: Once you have created your regular expression and rules, you can start searching for Indicators of Compromise (IoCs) and Indicators of Attack (IoAs) on the network using different tools. Step 6: Contain and eliminate threats: Once you have identified threats on your network, you can apply the controls to contain and eliminate threats.
Lab
Installing ELK
ELK is an acronym for Elasticsearch, Logstash, and Kibana. These three open source tools work together to provide a powerful data analysis and visualization solution.
- Elasticsearch: It serves as a search engine and data analysis platform.
- Logstash: This tool is used for ingesting, processing, and transforming data from various sources.
- Kibana: It acts as the frontend interface, allowing users to view and interact with the data processed by Elasticsearch.
Installing Elasticsearch
Download and install the
elasticsearchEnable and start the
elasticsearchservice
sudo systemctl daemon-reload
sudo systemctl enable elasticsearch.service
sudo systemctl start elasticsearch.service- You can check its status with
systemctl statuscommand
Installing Logstash
- Download and install
logstash
wget https://artifacts.elastic.co/downloads/logstash/logstash-7.15.2-amd64.deb
sudo dpkg -i logstash-7.15.2-amd64.deb- Enable the
logstashservice
sudo /bin/systemctl daemon-reload
sudo /bin/systemctl enable logstash.service
sudo systemctl start logstash
Installing Kibana
- Downlad and install
Kibana
wget https://artifacts.elastic.co/downloads/kibana/kibana-7.15.2-amd64.deb

sudo dpkg -i kibana-7.15.2-amd64.deb - Enable the
Kibanaservice
sudo /bin/systemctl daemon-reload
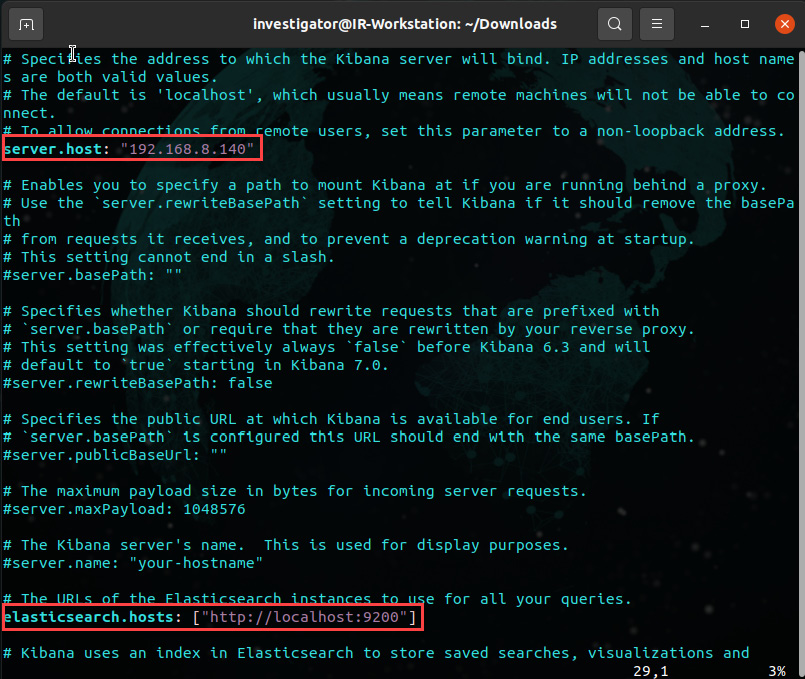
sudo /bin/systemctl enable kibana.service- Baefore starting the
Kibanaservice, edit/etc/kibana/kibana.ymlconfiguration file and change theserver.hostparameter to allow external connections and theelasticsearch.hostparameter to define the URL for the Elasticsearch instance, as shown in the following screenshot:
- You can start now the
Kibanaservice
Choose an ip address that matches your configuration
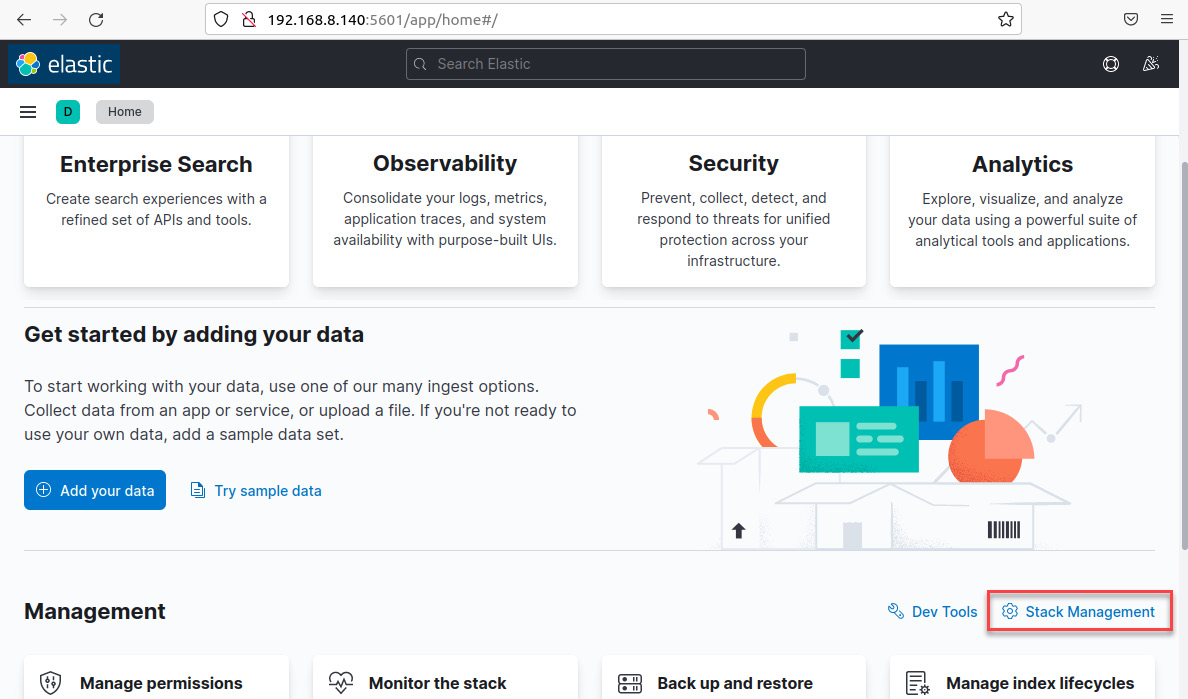
sudo systemctl start kibana.serviceFinally, open a web browser and navigate to http://192.168.8.140:5601 from your IR-Workstation virtual machine. You will see a welcome message so that you can start using ELK, as shown in the following screenshot:
Click on the
Explore on my ownbutton to enter the main ELK dashboard.
Creating a Logstash configuration file
To start receiving information via ELK, you need to create a Logstash configuration file that includes input, transformation, and output parameters. You have two options: create a configuration file from scratch or use a preconfigured template. In this case, we will use a sample template.
- On your Ubuntu Terminal, change to the
/etc/logstashdirectory. - Review the
logstash-sample.conf. - Copy the
logstash-sample.conffile to theconf.ddirectory and rename itwin.conf. - Restart the Logstash service to load the configuration file.
Configuring winglogbeat
We will configure winlogbeat to send the Windows logs to ELK.
On your IR-Laptop VM, log in and open a Windows Terminal/PowerShell instance with administrator privileges.
Install winlogbeat.
Change to the
C:\Program Files\Elastic\Beats\8.12.2\winlogbeatdirectory. Download in the winloagbeat.yml configuration file template.To receive the logs from your IR-Laptop VM, you need to change the IP address in the winlogbeat configuration file so that the
output.logstashparameter points it to the IR-Workstation VM. Follow these steps:Open the
winlogbeat.ymlfile using Visual Studio Code. Scroll down until you get to theoutput.logstash:section. Change thehosts:parameter to["192.168.8.140:5044"].Test the syntax of the configration file with this command :
.\winlogbeat.exe test config -c .\winlogbeat.yml -eStart the service :
Start-Service winlogbeat
Choose an ip address that matches your configuration
Your IR-Laptop VM will now send the Windows logs to the ELK instance on the IR-Workstation VM.
Creating an index in Kibana to visualize the information
The last part of configuring ELK consists of creating an index to define the way that Kibana will process and show the information on the dashboard. Follow these steps:
- On the IR-Workstation VM, from the Kibana dashboard, click on the
Stack Managementlink, as shown in the following screenshot:
- Next, click on the
Create index patternbutton. - In the
Create index patterndialog box, in theName textbox, write the following text:winlogbeat*. In the Timestamp field, click on the menu and select the@timestamp value. Click on theCreate index pattern`.
Now that you’ve created an index, you can start visualizing the information in Kibana. To open the Discover dashboard, follow these steps:
Click on the
hamburger menubutton at the top left of the dashboard. Click on theDiscoverlink.On the Discover dashboard, you can see the log information you’ve received from the IR-Laptop VM
Creating a repository of analytics
Installing Invoke-AtomicRedTeam
To finish configuring our lab, we need to install Red Canary’s Invoke-AtomicRedTeam from https://github.com/redcanaryco/invoke-atomicredteam. To do this, follow these steps:
- On your IR-Laptop VM, open a Windows terminal/PowerShell instance with administrator privileges and enable the execution permissions by running the following command:
Set-ExecutionPolicy -ExecutionPolicy Unrestricted- Run the following command to download and install the Execution Framework:
IEX (IWR 'https://raw.githubusercontent.com/redcanaryco/invoke-atomicredteam/master/install-atomicredteam.ps1' -UseBasicParsing);- Open Windows Defender and disable real-time protection and then, run the following command to install the Atomics folder:
Install-AtomicRedTeam –getAtomics- Add the
C:\AtomicRedTeamdirectory to Windows Defender Exclusions. - To start using the
Invoke-AtomicTestfunction, you must import the module by running the following command:
Import-Module "C:\AtomicRedTeam\invoke-atomicredteam\Invoke-AtomicRedTeam.psd1" -ForceYou need to run this command every time you open a new PowerShell console. If you want to make this functionality always available, you need to add the import to your PowerShell profile, as described in the respective GitHub repository, by running the following commands:
Import-Module "C:\AtomicRedTeam\invoke-atomicredteam\Invoke-AtomicRedTeam.psd1" -Force $PSDefaultParameterValues = @{"Invoke-AtomicTest:PathToAtomicsFolder"="C:\AtomicRedTeam\atomics"}Now that you’ve installed Red Canary’s
Invoke-AtomicRedTeam, you can run your tests from a PowerShell console.Additionally, you can create tests using the Atomic GUI by running the following command:
Start-AtomicGUIThis will open the Atomic Test Creation interface on port 8487, as shown in the following screenshot:
With the Atomic GUI, you can create tests for Windows, Linux, and macOS.
Emulating TPP with Red Canary’s Invoke-AtomicRedTeam
To start the test in our detection lab, we are going to select one of the MITRE ATT&CK techniques that’s commonly used by attackers, known as Command and Scripting Interpreter: PowerShell(T1059.001).
According to the Red Canary 2021 Threat Detection Report (https://redcanary.com/threat-detection-report/) and the Kaspersky Cybercriminals’ top LOLBins report (https://usa.kaspersky.com/blog/most-used-lolbins/25456/), abusing Microsoft PowerShell, the legitimate software engine and scripting language, was the most common tool to be used in cyberattacks, so creating detection analytics for PowerShell-related activity will be very useful.
Via your Windows terminal/PowerShell console, change to the
C:\AtomicRedTeamdirectoryRun the following command to see the list of tests that you can run for the
T1059.001technique:
Invoke-AtomicTest T1059.001 -ShowDetailsBrief- You can get details of each test by running the following command:
Invoke-AtomicTest T1059.001 -ShowDetailsSometimes, you need to configure or install additional tools to perform some of the tests, so it is recommended that you check the prerequisites before running a test. To do so, run the following command:
Invoke-AtomicTest T1059.001 -CheckPrereqs In this case, we will focus on the T1059.001-4 Obfuscation Tests and T1059.001-11 PowerShell Fileless Script Execution tests. To run the tests, execute the following command:
Invoke-AtomicTest T1059.001 -TestNumbers 4,11Generating and applying analytics rules
Now that you have run various tests on the technique to emulate this malicious behavior, let’s create the analytics. According to MITRE ATT&CK, the data components we can use to detect this technique are as follows:
Command execution
Module load
Process creation
Script Execution
In this case, we will use Elasticsearch/Kibana as a hunting platform, so we are going to create the analytics to run it in Kibana Query Language (KQL).
In https://car.mitre.org/analytics/by_technique, search the appropriate analytics query.
Go to your IR-Workstation virtual machine and, in your previously opened web browser, navigate to
Kibana | Discover.On the Kibana Search window, paste the analytics and press the Enter key
Don’t forget to adjust the range of time according to the period when you ran the atomic test.
You will see the records that match the search criteria of your analytics.
Click the expand button to review the details of the identified events
Now, let’s analyze each element of the detection and add it to a column to have all the components of the analytics in a single view.
Scroll down and click on the
Toggle columnin table button for thewinlog.event_id fieldScroll up and click on the Toggle column in table button for the
winlog.event_data.ParentCommandLine fieldScroll up and click on the Toggle column in table button for the
winlog.event_data.CommandLine fieldNow, you will see those filtered fields in column format, which will allow you to analyze and search for information
Finally, review and identify the events related to the IoA that was generated when you ran the atomic tests using Red Canary’s Invoke-AtomicTest.