IR Management with TheHive
- You should download this VM and import it to vmware
Effective incident response requires a robust incident management system. This system facilitates documentation, activity tracking, and decision-making at every stage of the process.
When choosing an incident management system, it’s crucial to consider the organization’s specific needs and capabilities. There are various options available, including both open source and commercial solutions.
TheHive stands out as more than just a ticketing system for incidents. It offers comprehensive case management features, seamless integration with playbooks, access to external intelligence sources through Cortex, and support for MITRE ATT&CK, among other capabilities.
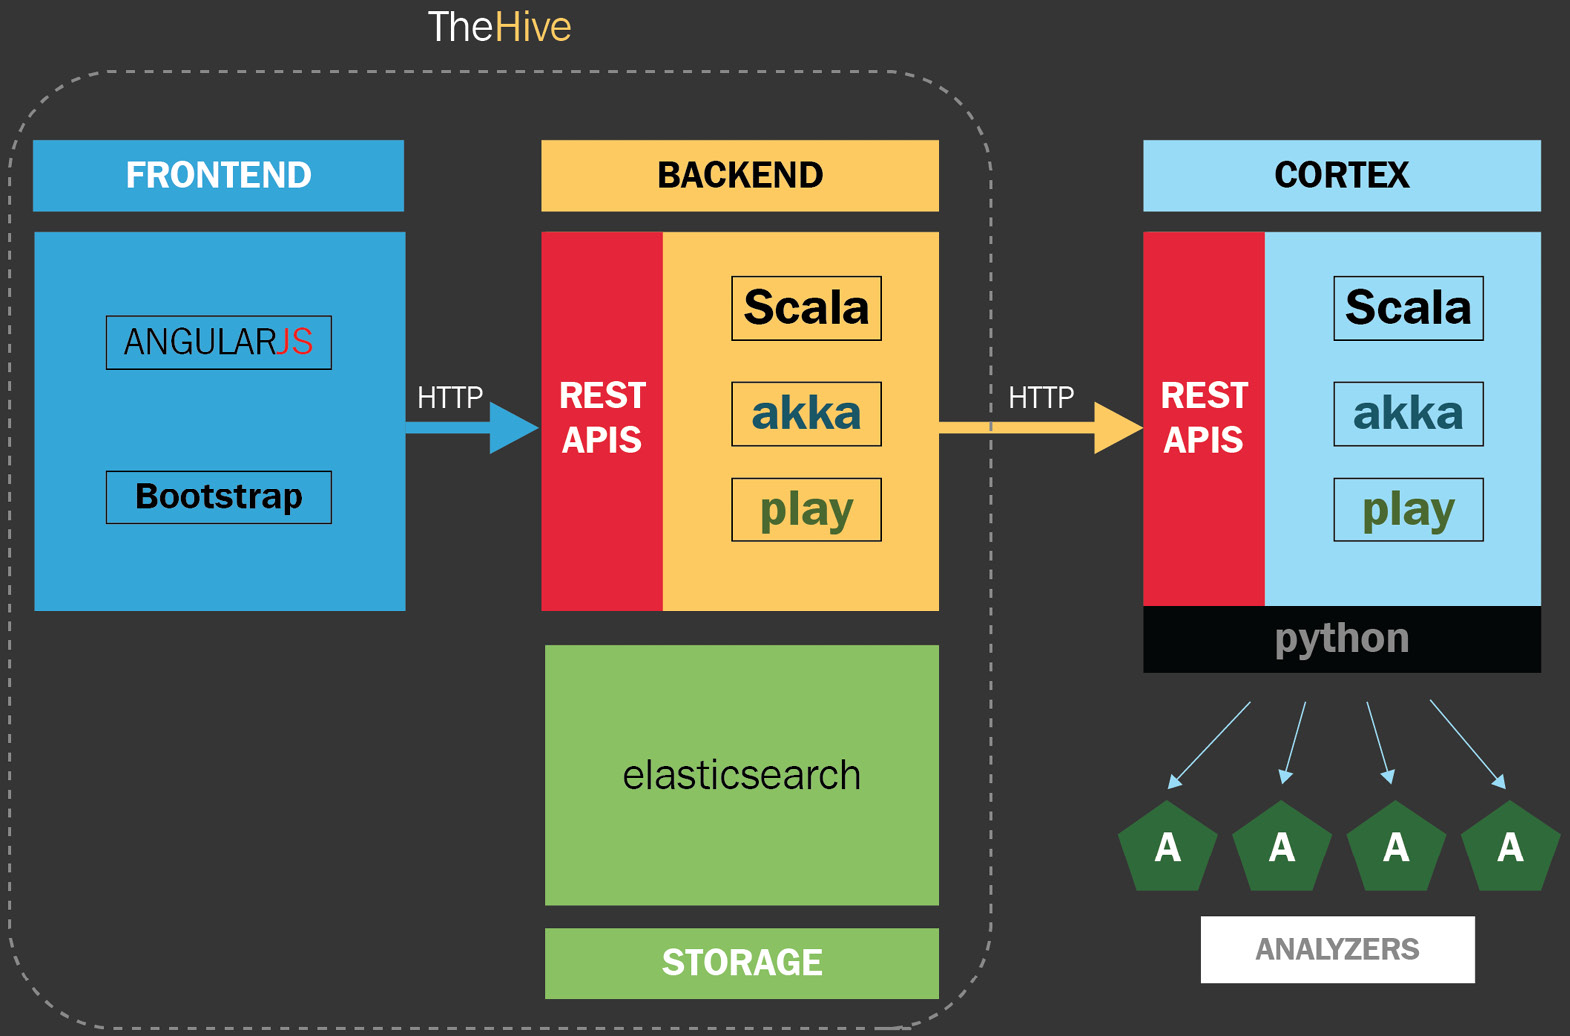
TheHive is composed of three components:
- TheHive: The incident and case management platform
- Cortex: An engine for observable analysis and response using threat intelligence
- TheHive4: A Python API client to expand the functionality to external sources
Setting up TheHive and creating cases
To connect to TheHive, you just need to navigate from your web browser to the same IP address assigned to your VM:
http://xxx.xxx.xxx.xxx/.Sign to TheHive account with predefined credentials
Create a new organization
- You can now configure the new organistion. For example to create the users that will operate the server and assign them a specific profile:
- admin: Can manage all the organization objects and users but can’t create cases
- analyst: Can create and manage cases and the related objects as tasks, observables, and TTPs
- read-only: Can’t create or modify objects and cases
Creating and managing cases
Incident response cases are the space where you can manage security incidents. Here, you can create cases in several ways:
- Manually
- Automatized
- Based on playbooks
- Logout and reconnect as
Investigator
The Security Operation Center SOC detected a new ransomware attack in one of the branches around the world. You will open a new case to start with the procedures related to this security incident.
Click on the + New Case button at the top left of the cases panel.
In the Create a new case window, fill in the fields using the following parameters under the Case details section and Click the
+ Createcase button.
Adding and assigning tasks
- In the Tasks section, click the
+Add Task button - Under the List of tasks section, fill in the following parameters:
Assign the task to the
IvestigatorNavigate to the Tasks panel on the toolbar at the top.
- Select the task to work on.
- Click on the
+ Add new task logbutton.
Under the Task logs section, write the following details and validate
Creating playbook case templates
- To create case templates based on incident response playbooks on TheHive, you must be signed in with org-admin privileges
- On the Organisation context, create new
Case Templaeswith these informations :
Once we’ve created the template, we will add the tasks related to the incident response playbook.
- Select the Tasks tab and click on the Add task button,
- In the new Add task dialog box, fill in the fields using the following parameters:
Assign the
thehiveuser to the task.Add the rest of the tasks of the Investigation section from the Playbook:
  1. Determine the scope
  2. Assess the impact
  3. Find the infection vector
Let’s use this template now by creating a new incident response case about a ransomware incident.
You can now manage the case, selecting and assigning tasks to the incident responders and collaborators.
- To start managing the case, click on the 001 Ransomware related security incident case.
- Click on the Tasks tab.
- Under this tab, you will see the list of tasks based on the ransomware template created previously. Here, you can edit, add, or delete tasks according to the context of this case or assign the activities as appropriate
Adding observables
When you are working on an incident, it’s very important to include information about Indicators of Compromise (IoCs) or Indicators of Attack (IoAs) as they are found. Take these steps to do this:
- Navigate to the Observables panel.
- Click the + Add observable(s) button.
This will open the Create new observable(s) window. Here you can add the details for any IoC found.
- Fill in the fields with the following parameters:
Type: hash
Value: 561cffbaba71a6e8cc1cdceda990ead4
TLP: RED
Is IOC: Checked
Tags: malware, ransomware, hash
Description: Suspicious executable- Click the + Create observable(s) button.
Adding Observables
The term observable is related to IoC or IoA. The idea here is to have a central repository where analysts can share intelligence and make it actionable. This is a powerful feature of TheHive because you can use Cortex running different analyzers. To get intelligence provided from Cortex, you just need to run the preconfigured analyzers. The analyzers are tools that connect to external sources of intelligence through APIs.
- Navigate to the Observables section.
- Select the observable that you want to analyze – in this case, the hash that we added previously.
- Click the 1 selected observable button.
- Click on the Run analyzers button
The Analyzer observable(s) window will open, and the external intelligence sources will be displayed. Depending on the observable, different sources of information may appear.
- Select the sources from which you want to get intelligence.
- Click the Run selected analyzers button.
- In this case, you can select the following intelligence sources:
Maltiverse_Report_1_0,TeamCymruMHR_1_0, andCIRCLHashlookup_1_0 - Now, wait a few moments for the analyzers to look for the information. The results will appear at the bottom of the observable in blue labels.
- If no matches are found with those indicators, you can try with other intelligence sources.
- If this indicator was seen before, you will view the context details and know if it is related to a campaign or known malicious actors. In this case, this hash is related to a malware sample, so we will get more details about this threat.
- Click on the
Maltiverse:Report="n/atag and you will see the details of the results of this analysis - Copy the hash value to the clipboard and open a new tab on your web browser to navigate to the maltiverse web page: https://www.maltiverse.com/. Paste the hash value of the malicious file into the Search engine textbox and then click on the Search button,
- On the Search result panel, you will see the name(s) of the file along with additional information
- Click on the name of the file(s).
- You will see additional information regarding this malware, for instance, the number of antivirus detections, IDS alerts, processes, HTTP events, contacted hosts, and DNS requests. Scroll down the web page to see the antivirus positives.
- As you can see, there are detections referencing the threat as belonging to the Sodinokibi Ransomware family. Additionally, you can also search other intelligence sources, such as VirusTotal and VirusBay.
In a cybersecurity incident, you will find different IoCs, and in the same way as you did with the hash value, you can add observables and analyze them as URLs, IP addresses, filenames, or Windows Registry keys, among other things. At this point, we have valuable information that will allow us to search for this IoC on other devices.
However, in a cybersecurity incident, the context is also very important. Understanding the Cyber Kill Chain and the MITRE ATT&CK Framework will help you for this purpose.
Documenting MITRE ATT&CK TTPs in TheHive
- Navigate to the
TTPspanel at the top of the case toolbar. - Click the +
Add TTPbutton. - In the
Add Tactic, Technique and Procedurewindow, complete the fields with the following parameters:
Tactic: Execution

Sub Technique: T1059.001 – Command and Scripting Interpreter: PowerShell- Click on the
Add TTPbutton.
At this point, you initiated a new security incident case and performed the following activities:
You created a new case related to a security incident. You created a new task and assigned it to an analyst. You created a new entry for an observable and ran an analysis for intelligence information. You added a new TTP entry associated with the behavior of the attacker.
To view the dashboard with the key information about your cases, do the following:
- Click on the
TheHivelogo at the top left of the main panel. - Click on the
Statsbutton at the top right.
You will see information:
- Case by Status
- Case by Resolution
- Categories of cases by tag
- The list of cases with detailsYou can customize this dashboard according to your preferences and needs if you log in as an organization administrator.
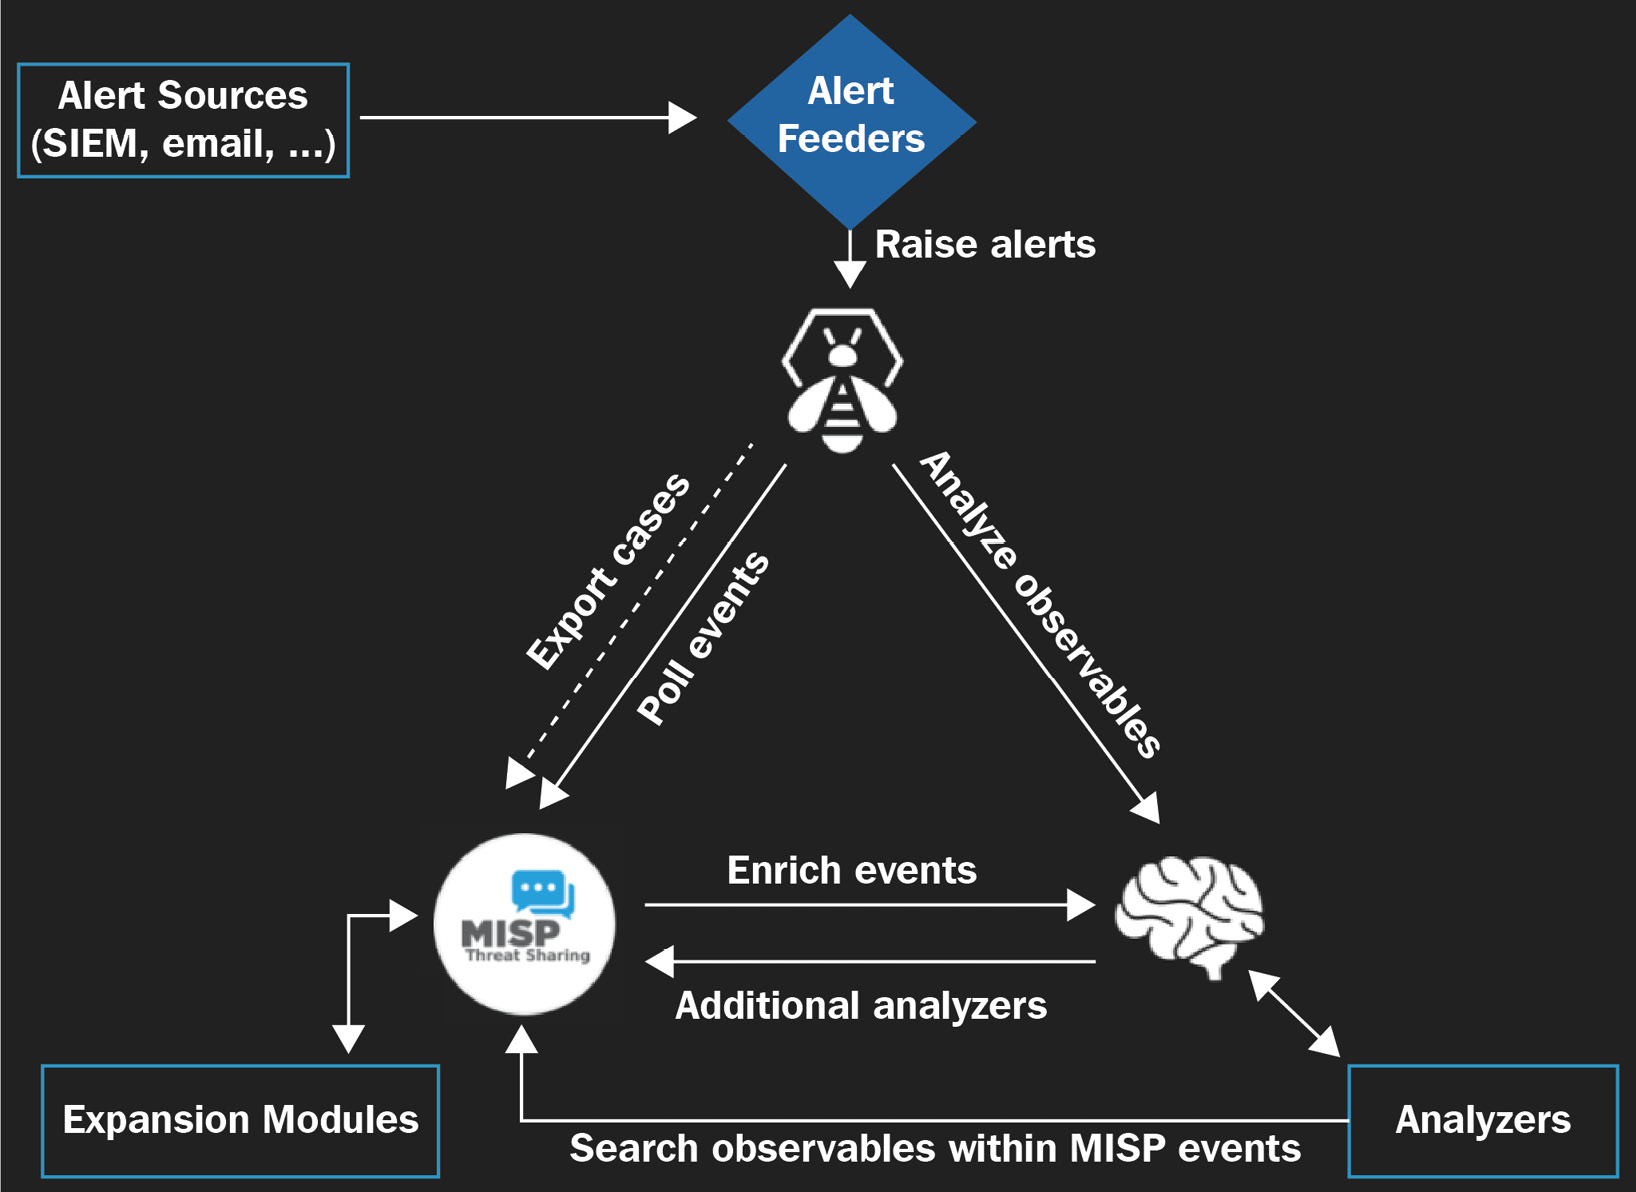
Integrating intelligence with Cortex
Cortex is a powerful engine to analyze observables and get intelligence from external sources.
The integration of TheHive and Cortex allows you to get threat intelligence information from different sources without having to change to different platforms.
You can integrate Cortex with different threat intelligence platforms such as the Malware Information Sharing Project (MISP), etc.
Configuring the analyzers
One of the features that you can configure in Cortex is the analyzers. The steps to configure analyzers are as follows:
- Log in to the Cortex portal using the default
orgadmincredentials :thehive/thehive1234
On the main panel, you will see Jobs History, which shows the most recent analysis processed from TheHive or directly here and the results of those processes.
- Here, you can filter the analysis by Data Types, Job Type, and Analyzers, search by Observable, and delete a specific job.
Now, we will review the configuration of the analyzers included with Cortex
- Click on the Analyzers button on the toolbar at the top of the main panel. You will see the list of analyzers enabled for this organization
If you want to enable or disable analyzers, you need to log off and then log on again by using the following administrator credentials: admin/thehive1234.
- On the toolbar, select the Organization button.
- Select the Analyzers panel.
- Under the Analyzer section, you will see the list of analyzers, and on the right, the option to enable or disable them. `
It’s important to mention that some analyzers will require an API key, so before you can enable them, you will need to provide the required information.
You can integrate additional analyzers such as VirusTotal, DomainTools, or many others into TheHive. Read the documentation in this Cortex GitHub repository: https://github.com/TheHive-Project/CortexDocs.